
AWAIS KHAN
Data Analyst skilled in Excel, SQL, Power BI, Tableau & Python.
Work
Cricket worldcup 2023
The Cricket World cup 2023 Analysis unveil the insights and highlights of tournament. The project includes Phase wise batting and bowling analysis. The analysis also provides innings breakdown across all phases for more clarity. It also includes induvial player performance in tournament and also break down top player performance.
Tools Python, Tableau
Sakila PROJECT
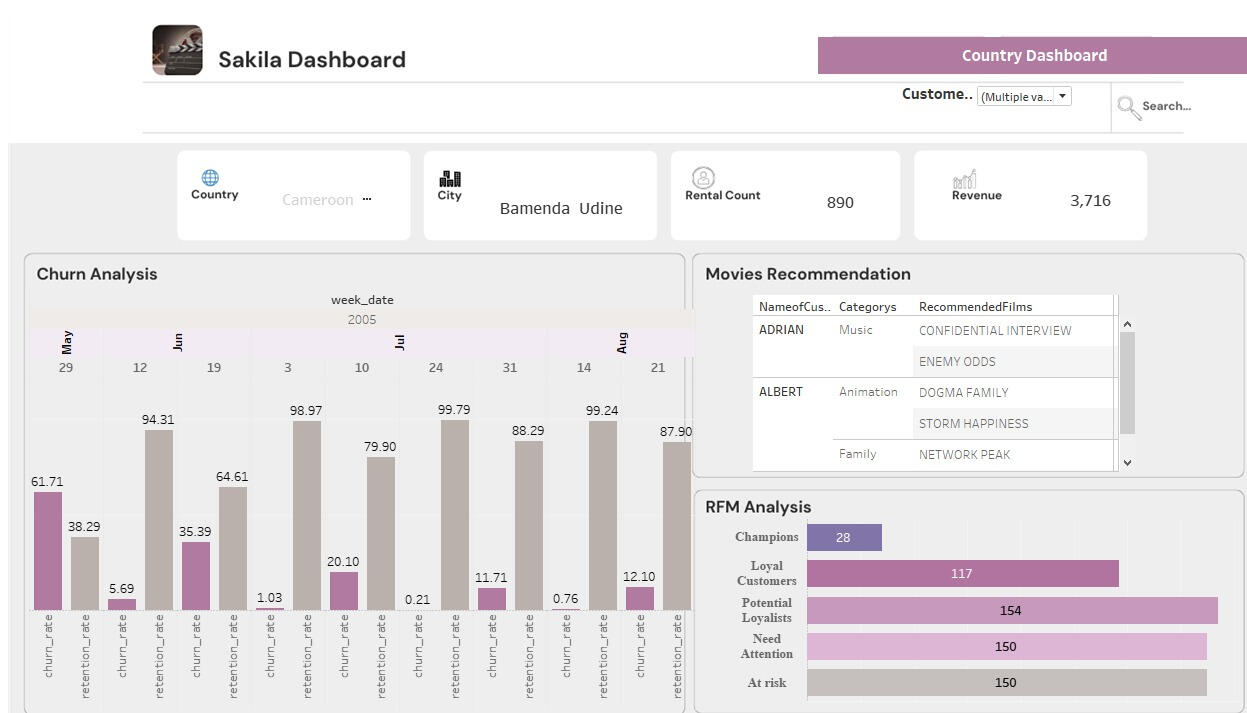
The Sakila project emulates a DVD rental store's data for real-world data management scenarios. This database includes information on movies, actors, the relationships between films and actors, as well as a central inventory table that links films, stores, and rentals.
The project includes detail SQL analysis coupled with Tableau visualization. The SQL Analysis includes Film Analysis, Country Analysis, RFM Analysis, Churn Analysis and Customer movie recomenadtion sysytem.
Tools SQL ,Power BI
HOSPITALITY REVENUE ANALYTICS

This Power BI dashboard provides a comprehensive overview of key metrics and trends for hotel and hospitality businesses. Users can filter data by city and room type.
Key metrics displayed in the dashboard include revenue, RevPAR, occupancy percentage, ADR, DSRN, and Realisation. Day type metrics for Weekday and Weekend are displayed for RevPAR, occupancy percentage, ADR, and Realisation.Realisation % and ADR by Platform are provided to help businesses identify the most effective booking platforms. The trend analysis section provides a visual representation of the performance of key metrics over time. The pie chart shows the percentage of revenue by category, which is divided into luxury and business categories.
Tools Excel Power BI
Ecommerce sales dashboard

This Power BI dashboard provides insights on the sales performance of the company, the categories and products that are performing well, and the regions and shipping types that are contributing to the sales. The YTD profit margin has increased by 5.37% to 11.58%, which is a positive sign for the company. The dashboard is designed to help the business make informed decisions about their sales strategy & identify areas for improvement to increase sales by 5%.
Tools Excel Power BI
Data Science SALARIES DASHBOARD
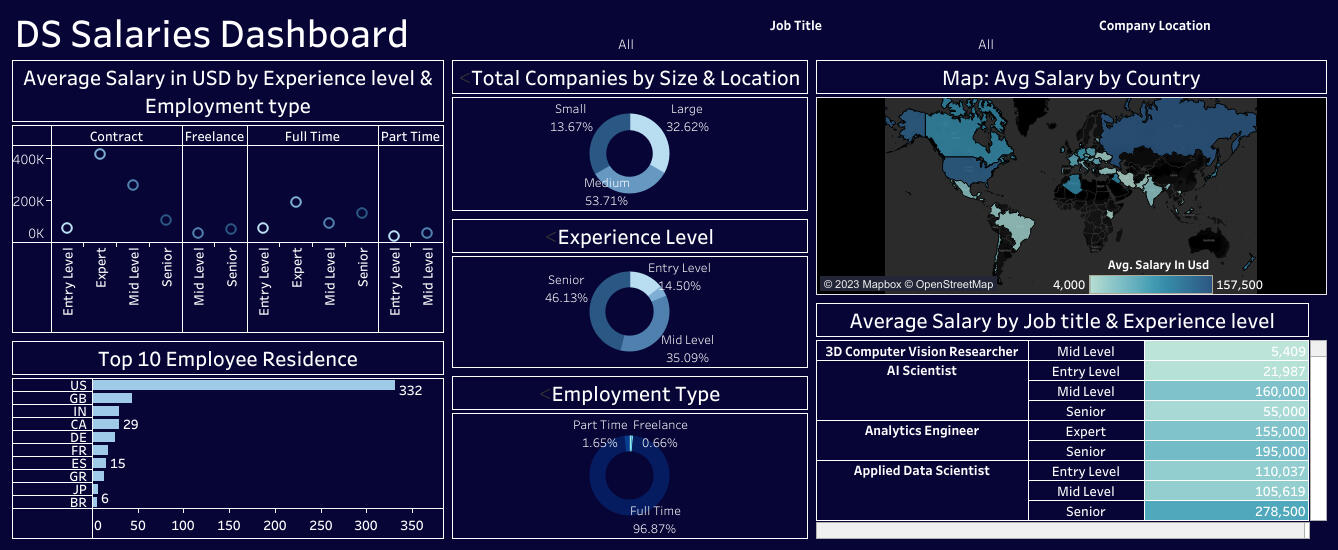
This Tableau dashboard provides an overview of data science salaries across different job titles, experience levels, and employment types.
Tools Excel Tableau
About
Hi! I am dedicated and detail oriented data analyst with a passion for unravelling the stories hidden within the numbers. My journey in the realm of data began with a fascination for its potential to drive informed decision-making and create tangible impacts. I thrive on the challenge of translating raw data into actionable insights, empowering organizations to make strategic decisions. Beyond the world of data, I'm Cricket nerd, loves travelling and exploring food.
Contact
As you peruse my portfolio, you'll discover a collection of projects that showcase my analytical prowess and problem-solving acumen. Let's connect and explore how we can leverage the power of data to drive innovation and foster meaningful change.Thank you for visiting, and I look forward to the exciting data-driven adventures ahead!